Power and Process Monitoring
The iba system tells you exactly what is happening in your plants and your energy system. The components are all perfectly coordinated with one…
Learn more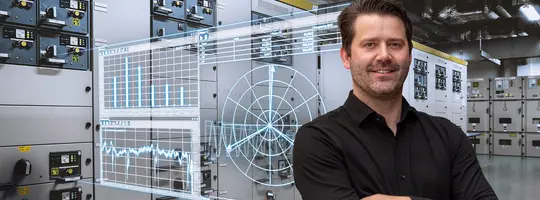
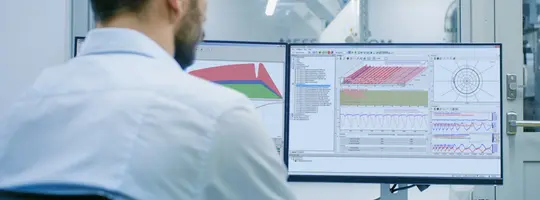
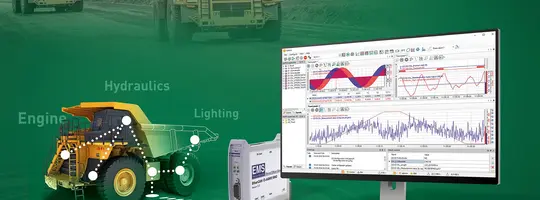
With ibaQPanel, process and quality data, conditions, events and video images in live mode can be displayed in a technology-related representation. It combines the functionality of an interactive measurement value display with elements from the area of HMI and can be integrated seamlessly in ibaPDA.
Talk to an Expert

The ibaQPanel displays can be easily added to the classic displays in ibaPDA.
Trends, alpha numerical and condition-dependent information as well as flatness or temperature profiles or online FFT analyses can be displayed with ibaQPanel in real time. Signal trends can be displayed both time or length related. Thus, measured values which are relevant for long or flat products’ quality may be displayed in relation to the length segment.
Discover the comprehensive possibilities of the ibaQPanel software.
Get inspired by product use cases and learn how value is created.
These leading companies already use this component of the iba system.


Contact us – we look forward to hearing from you! Our experts are happy to answer any questions and help you with any challenges you may face.
Talk to an ExpertRead the inspiring success stories of our satisfied customers.
Download important resources or contact our support team for further assistance.
Please contact your local sales partner for details.
| Order no. | Name | Description |
|---|---|---|
| 30.670040 | ibaQPanel-V7-Add-On | Add-On license for ibaPDA for to display process and quality data on an HMI window |
ibaQPanel enables technology-oriented visualization of live process and quality data directly within customized HMI layouts. Trends, conditions, FFT analyses, temperature profiles, and synchronized video streams can be displayed together, allowing operators to interpret critical process information instantly and respond faster to deviations.
With ibaQPanel, quality data can be displayed not only time-based but also length-related. Thickness, temperature, or flatness profiles can therefore be visualized precisely along the product length. Especially in continuous processes, this improves product-specific quality monitoring and simplifies root cause analysis.
ibaQPanel supports specialized visualizations such as FFT spectra, orbit diagrams, vector displays, and 2D color maps. This makes it possible to analyze mechanical vibrations, harmonics, or power quality parameters in real time while monitoring them together with process data in one unified interface.
In addition to visualization, ibaQPanel also enables direct user interaction through sliders, switches, checkboxes, or text fields. Operators can adjust setpoints, select operating modes, acknowledge alarms, or document comments directly within the interface.
Via ActiveX, ibaQPanel can be integrated directly into existing HMI systems. This provides high-resolution process data, synchronized video displays, and advanced analysis functions within the existing operator environment without replacing current systems.