How FEST Makes Process Data Usable for Operations, Analysis and Maintenance
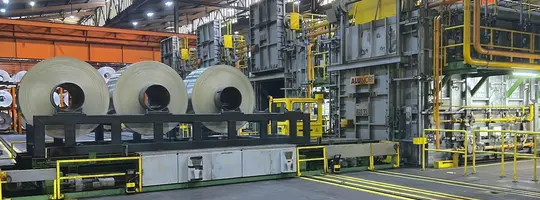
Based on the iba system, FEST has developed a data architecture that covers the entire process.
Learn more FEST Group
iba Oceania designed and implemented a Visualisation and Acquisition Package with ibaHD-Server and ibaQPanel to assist operators monitor and manage efficient despatch of diesel generation.

Varying capacity of generation plant and service condition of plant has an impact on power station fuel efficiency. Live display of the generation and power station key performance indicators empower operations with the ability to make energy saving decisions resulting in reduced fuel consumption and energy efficiency improvements.
A basic starter acquisition package of Voltage, current and fuel metering via a ibaPADU-S-CM modular system enables access to live Specific Fuel Consumption, Fuel Efficiency and Power Quality indicators on up to 4 machines or feeders. The system can be readily expanded to incorporate:
The ibaPDA solution is also fully integrable with modern SCADA systems via Active-X controls enhancing operating capability and experience.
The high speed acquisition capabilities enable the system to be used as a transient fault recorder to assist operations with fault analysis and network discrimination. Cross referencing T&D line crew reports with transient fault data assist engineering with enhanced distribution protection design leading to reduced nuisance trips and increased network availability.
As renewables participate in increasing levels of network penetration, issues regarding voltage and frequency stability as well as with spinning reserve and reactive power support lead to significant concern. The high fidelity and resolution data allow power station engineers to accurately measure and assess grid stability and the impacts of renewables such as solar, in order to update models to reflect the power system, prepare plans and be prepared for the future.
The ibaPDA solution provides statistical analysis and reporting capabilities to support benchmarking covering areas including power quality, availability, downtime, Energy production/loss, fuel usage, restoration time, load profiling and other KPIs.

ibaPDA is a PC-based system to centrally record data. The recording can be made to store data continuously or event based. An efficient report generator allows for the creation of customized analytical reports.
ibaHD-Server find past events rapidly, using the high resolution Historical Data (HD) server – also for continuous and long running projects. With the zoom function, you can travel from the annual, monthly or weekly overview down to the millisecond range.
ibaQPanel enables enhanced display process and quality data, conditions and events in live mode in a technology-related representation. It combines the functionality of an interactive measurement value display with elements from the area of HMI.
Download the demo of ibaPDA and ibaAnalyzer and start optimizing your processes today. Try it free of charge for 30 days!
Request a ibaPDA-Demo LicenseThe following functions of the iba system are used in this success story.
Read more inspiring success stories of our satisfied customers.
Improving efficiency requires continuous acquisition and evaluation of performance KPIs such as specific fuel consumption, power generation, and power quality. With ibaPDA and ibaHD-Server, these data are captured at high resolution and stored long-term. ibaQPanel provides real-time visualization of relevant KPIs. This enables operators to make informed decisions to optimize fuel usage and overall plant performance.
Real-time availability of operational data enables immediate assessment of current plant conditions. With ibaQPanel, KPIs such as fuel efficiency, load distribution, and voltage quality are clearly visualized. This transparency allows operators to quickly adjust operating parameters and avoid inefficient operating conditions. As a result, energy consumption is sustainably reduced.
High-frequency data acquisition enables detailed analysis of transient events and grid disturbances. With ibaPDA, the system can be used as a fault recorder to precisely capture error conditions. Correlating this data with grid reports allows for in-depth root cause analysis. This supports the optimization of protection schemes and improves grid availability.
Integrating renewable energy requires accurate assessment of grid parameters such as voltage, frequency, and reactive power. High-resolution data from ibaPDA enables detailed analysis of these parameters. This allows engineers to better understand the impact of renewable energy sources and update system models accordingly. This contributes to maintaining grid stability.
Automated reporting enables structured and continuous evaluation of performance data. With ibaPDA and its integrated report generator, KPIs related to availability, energy generation, fuel consumption, and load profiles can be generated. These data provide the basis for benchmarking and optimization measures. This sustainably improves the efficiency of power plant operations.