How FEST Makes Process Data Usable for Operations, Analysis and Maintenance
Based on the iba system, FEST has developed a data architecture that covers the entire process.
Learn more FEST Group
From Paper Chart Recorders to Modern Data Acquisition: To ensure reliable analysis and visualization of furnace data, Aluminium Norf relies on the iba system.
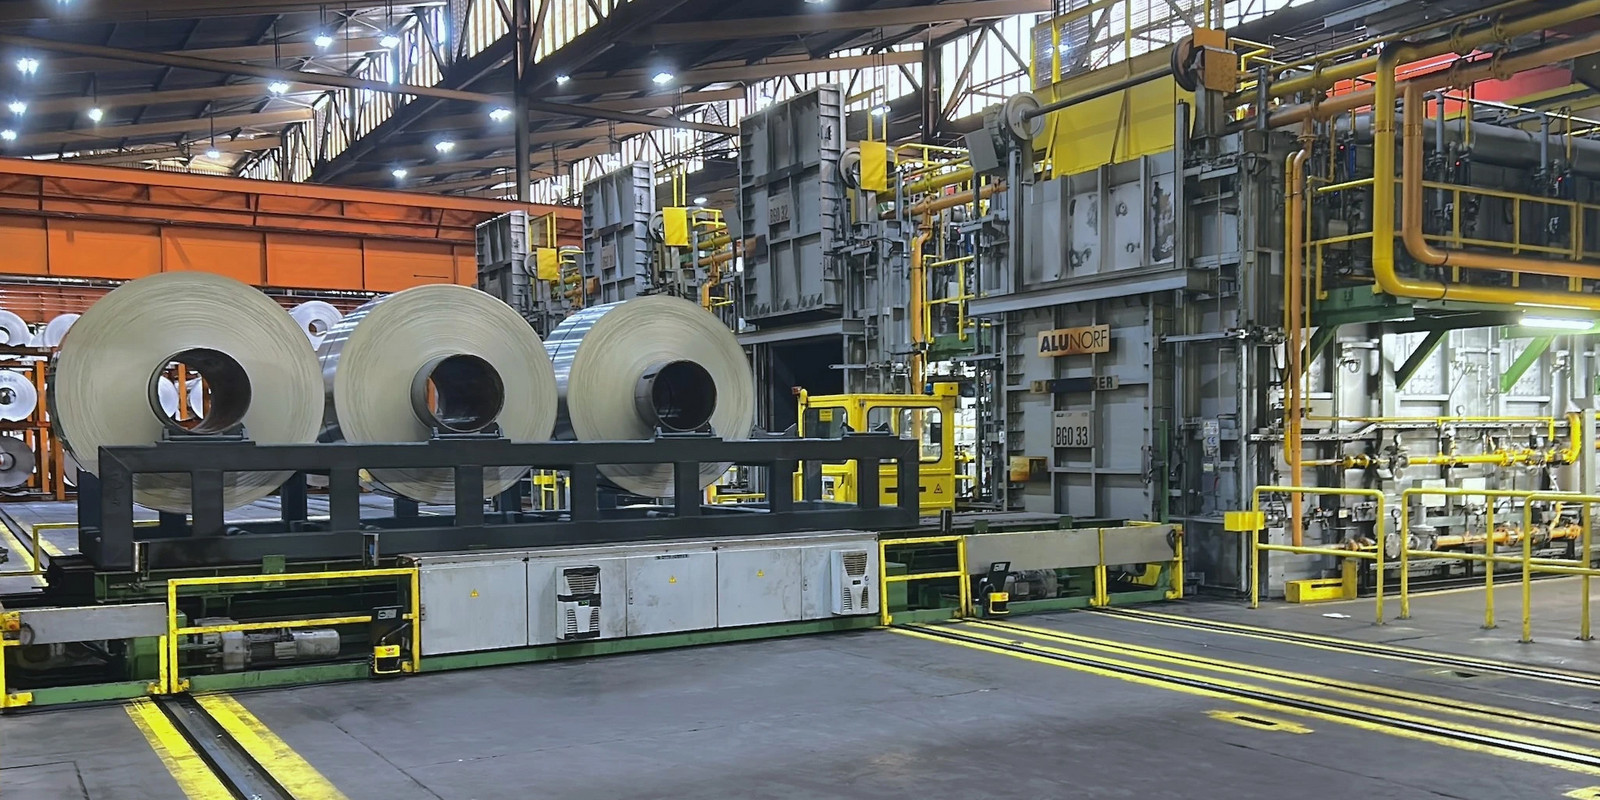
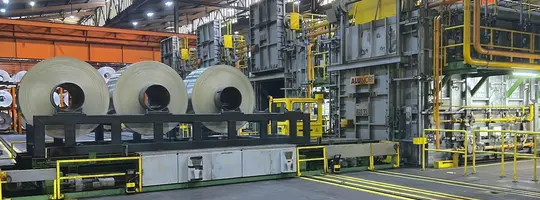
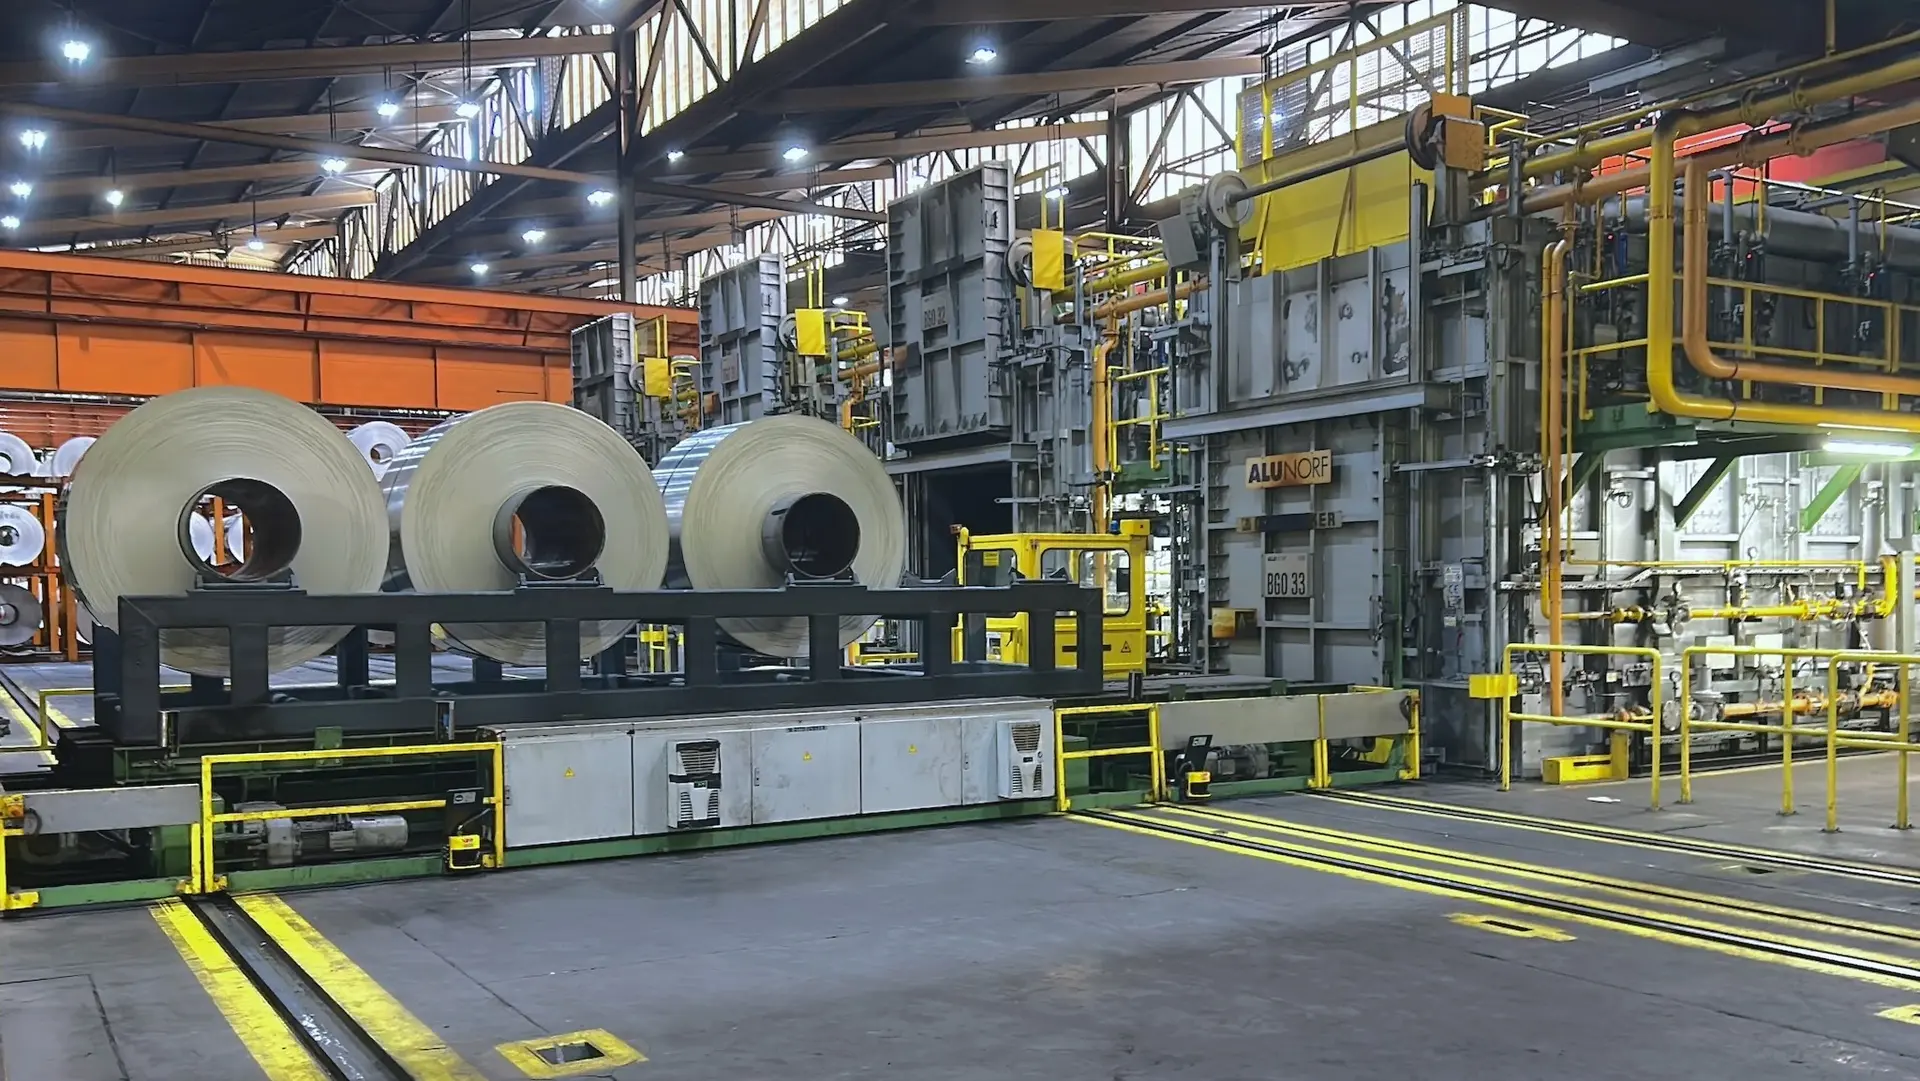
At the batch annealing facility of Aluminium Norf GmbH, approximately 300,000 tons of rolled aluminum pass through 25 batch annealing furnaces every year. Through controlled heating and cooling under a protective gas atmosphere, the material—which is ultimately processed for the printing, packaging, and automotive industries—is optimized in terms of its mechanical and microstructural properties.
For the operator of the world's largest aluminum smelting and rolling plant, it is therefore essential to reliably capture, monitor, and analyze the key process parameters of each furnace, including furnace zone temperatures, protective gas flow rates, protective gas composition, and furnace pressure. Until recently, this was accomplished using paper chart recorders. Since these records played a critical role in process monitoring and control, while maintenance of the recorders became increasingly time-consuming, Aluminium Norf decided to replace them with a modern digital solution. Based on positive experiences already gained in the hot and cold rolling areas, the company selected the iba system for process data acquisition and analysis.
The relevant process and furnace control data are acquired by two ibaPDA systems and continuously stored in a central ibaHD-Server. Using the Time Period functionality, the archived data can be assigned to the respective annealing batches based on their production time frames. Further processing of these individual time periods is then performed automatically using ibaDatCoordinator.
In addition, Alunorf can now easily compare individual annealing batches over extended periods of time, providing valuable insights into process stability. Compared to traditional paper chart recording, the iba system offers a significantly more efficient solution for the long-term documentation and verification of historical process data.
A key requirement was that operators should continue to be able to create batch-specific comments. This functionality was retained and integrated into the new system. The comments are archived together with the process data and the DAT files generated by the two ibaPDA systems in ibaHD-Server. This feature was incorporated into a centralized visualization environment based on ibaQPanel, which was developed in close collaboration with Aluminium Norf. The visualization accesses the stored HD data and provides a unified view of all furnace data, even though the data is acquired by two separate ibaPDA systems.
Operators can access the visualization both from the control room and remotely via tablet devices. The scale of the project is reflected in the number of visualization layouts created: more than 70 dedicated layouts were developed to provide detailed process views. A comprehensive user management concept ensures that both the ibaQPanel visualizations and the underlying systems are protected against unauthorized access.
To provide operators with a quick overview of all furnaces, Alunorf developed a centralized process visualization consisting of three sub-layouts. The most important process variables can be displayed online as trend charts over time. The time axis has been specifically configured to provide a complete overview of the entire annealing cycle. If an annealing process exceeds five minutes, the dynamic time axis automatically expands to accommodate the longer duration. Operators can zoom into individual trend graphs at any time to examine shorter time periods in greater detail.
In addition, tolerance bands have been defined for the most important process variables. Whenever a value exceeds or falls below the specified limits, the system automatically generates a warning notification for the operator.

The implementation of the iba system has not only optimized our workflows but has also significantly improved the quality and transparency of our processes.
Marcus Kesselmans
Process Engineer, Aluminium Norf GmbH
The following functions of the iba system are used in this success story.
Download the demo of ibaPDA and ibaAnalyzer and start optimizing your processes today. Try it free of charge for 30 days!
Request a ibaPDA-Demo LicenseRead more inspiring success stories of our satisfied customers.
For centralized acquisition and long-term archiving of furnace and process data, distributed measurement systems are commonly used that continuously transfer their data to a central storage system. In the described application, signals from multiple measurement systems are consolidated and stored on a central ibaHD server, creating a continuous history of all relevant process variables. This enables long-term documentation of furnace parameters and improves the comparability of annealing batches over many years.
Digital visualization systems enable a consolidated representation of all furnace data within a single interface, even when the data originates from separate acquisition systems. In this application, a visualization based on ibaQPanel is used to display process values from multiple annealing furnaces in a synchronized manner and make them analyzable over time trends. This gives operators a fast overview of plant status and allows deviations to be detected and assessed early.
By assigning process data to defined time periods, individual production batches can be clearly separated and analyzed in a targeted way. In the described solution, so-called Time Periods are used to automatically link annealing batches with the corresponding measurement data from the ibaHD server. This structure enables efficient analysis, as each batch is treated as an independent dataset that can be specifically compared with others.
In thermal processes such as annealing, continuous monitoring of critical parameters is essential to ensure quality and process stability. Defined tolerance ranges allow deviations in furnace zones, gas atmosphere, or pressure to be automatically detected and issued as alerts. Combined with a centralized visualization, the system supports rapid operator response and reduces the risk of quality deviations.
In large-scale industrial plants, secure and structured operation is essential to ensure consistent process data. In the described solution, operator comments are stored directly alongside process data and archived measurements in the central system and integrated into the visualization. Combined with role-based user management, this creates a protected environment that ensures both data integrity and traceable documentation across the entire production process.