IEC 61850 Substation Monitoring
Accurately acquire events in substations: Thanks to its IEC 61850 interfaces, the iba system enables status information to be obtained from the IEC…
Learn more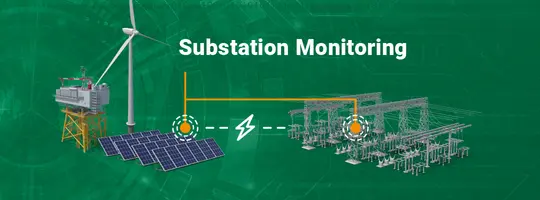
The iba system is ideal for evaluating your energy efficiency as it monitors energy and process data together and gives you a constant overview of all performance indicators and characteristic values.

When used as an energy monitoring system, an important factor is the ability to monitor the energy data over the long term. The data acquired is usually collected in 15-minute intervals over a long period of time to enable statistical analyses, but the recording intervals can also be adjusted in different ways if required.
Discover how the iba system supports operational excellence and enables visibility for the grids of tomorrow. Schedule a one-on-one call now.
Book Your 1:1 Call
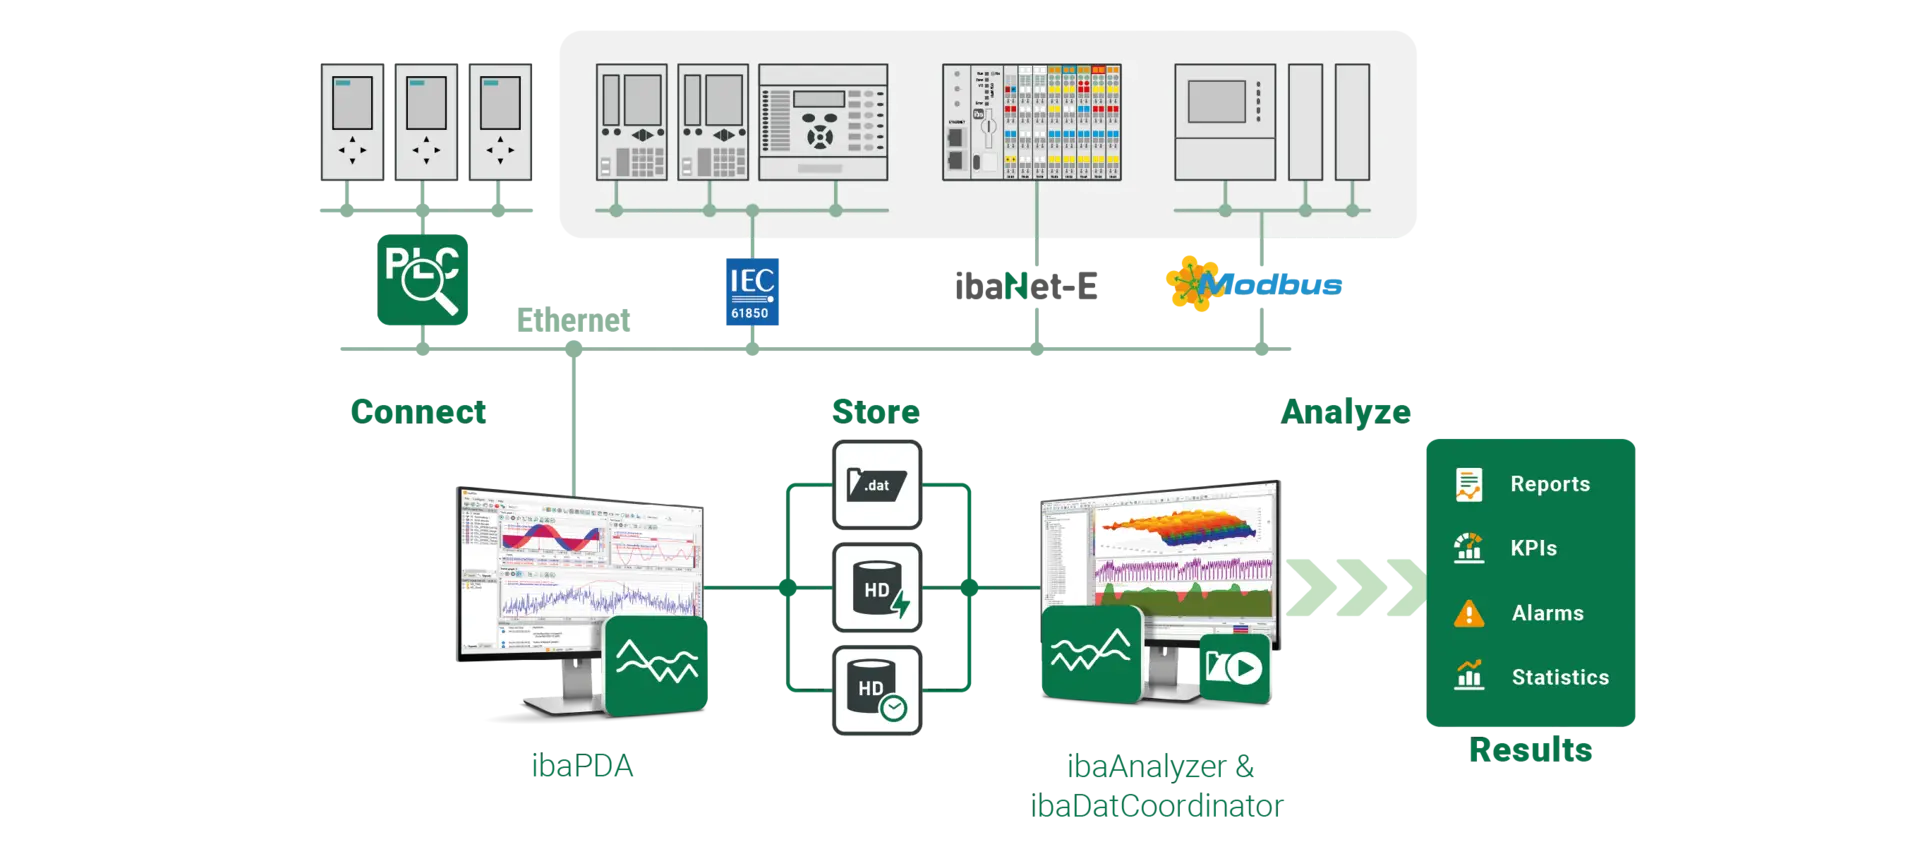
It does not matter where the data comes from – the iba system determines and calculates the data you need. In addition to the high-resolution devices from iba (from the PADU range or ibaMAQ system, for example), you can also easily integrate measuring devices from external manufacturers into the iba system via a communication interface such as Modbus TCP in order to acquire energy data. Measurement data from controllers (e.g., SIMATIC S7) can easily be integrated using Xplorer interfaces.
Events from the process, switchgear, or power quality analysis which are linked via other interfaces are incorporated into the overall data set and also available for analyses at a later date. The iba system determines performance indicators and characteristic values to enable efficient, results-oriented energy management.
You benefit because you don’t just see the energy flows and can evaluate them statistically, it’s also easy to see how things are linked with the production and event data. If required, you can use anomalies as a trigger for the event monitoring function, investigate them with a resolution at ms or even μs level, and identify and address appropriate measures.
Energy monitoring can be added to all existing iba systems or set up as a new, stand-alone system. ibaPDA’s comprehensive connectivity comes into its own here as it enables existing devices to be integrated with ease.
The signals in an energy system have very different properties and structures, but the energy sampling concept in ibaPDA enables the signals to be structured clearly. You can also save metadata, such as descriptive information and other technical data, and use it for analyses later on.
Measurement data and calculated characteristic values from the energy data are shown clearly on a dashboard using ibaDaVIS (data visualization and information system). In the example above, line charts show the energy production and consumption gradient over a freely definable period of time, e.g., a year. For this period of time, bar and pie charts visualize the statistic deviation of all the values included, which could be grouped by hours in the course of the day, for example, or by consumers and what proportion of the overall consumption they are responsible for. The zoom function provides quick access to daily or minute-based views of the trends, so you can see when the plant or energy system caused events. Whereas the 15-minute values of just an energy management system (bottom left figure) usually only show a rough gradient, the high-resolution measured values provided by the iba system (bottom right figure) clearly show peaks and dips. If high-resolution measuring devices have been connected to the iba system, you can see events accurately right down to μs level (cf. event monitoring).
The following functions of the iba system are used in this application.
These leading companies already rely on the iba system.














Download the demo of ibaPDA and ibaAnalyzer and start optimizing your processes today. Try it free of charge for 30 days!
Request a ibaPDA-Demo LicenseSuccessful applications and real solutions with the iba system.
Accurately acquire events in substations: Thanks to its IEC 61850 interfaces, the iba system enables status information to be obtained from the IEC…
Learn moreAnalyze system faults with precise, high-resolution measurements: Electric systems react extremely quickly to errors. Compensation processes then…
Learn more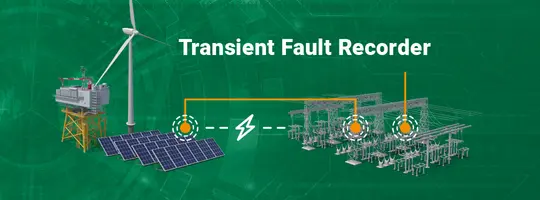
Identify optimization potential with power and process monitoring: Power quality measurements are normalized measurements that qualify the voltage…
Learn more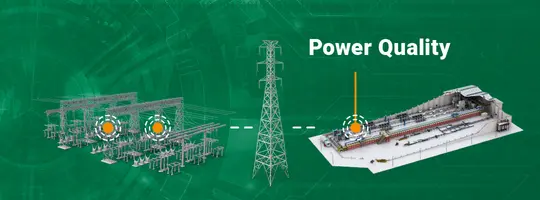
The iba system tells you exactly what is happening in your plants and your energy system. The components are all perfectly coordinated with one…
Learn more