


Power and Process Monitoring
The iba system tells you exactly what is happening in your plants and your energy system. The components are all perfectly coordinated with one…
Learn more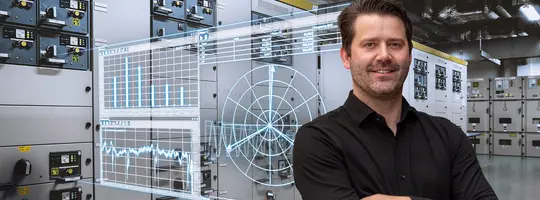
ibaDaVIS allows the visualization and analysis of your process and quality data as well as characteristic values in the web browser. You can interactively access detailed data from the overview on the dashboard.
Talk to an Expert

ibaDaVIS offers a completely new overview and clarity thanks to in-depth insight into your data and processes.
Plants and machines can be compared with one other based on their characteristic values. The precise information required to monitor plants and machines and to identify weak points and optimization potential can be quickly and easily displayed.
Discover the comprehensive possibilities of the ibaDaVIS software.
Get inspired by product use cases and learn how value is created.
The iba system tells you exactly what is happening in your plants and your energy system. The components are all perfectly coordinated with one…
Learn moreFailures in automated systems can lead to production downtime and inferior quality. Failure mode analysis is easily achieved for maintenance personnel…
Learn more
Automated real time monitoring of processes, machines and plants is based on acquired measurement data, camera images and calculated characteristic…
Learn more
The iba Condition Monitoring System combines vibration-based characteristic values with process and material data to reliably detect wear on plants.…
Learn more
For documenting the automatically manufactured products, quality data and characteristic values need to be calculated and reliably stored in a quality…
Learn more
The iba system enables continuous acquisition and long-term storage of process and machine data in high temporal resolution. All data is centrally…
Learn more
For reliable real-time monitoring of vibrations, offline analysis tools for optimization and validation are indispensable. The iba system offers you…
Learn more
Technical Data Acquisition and Analysis with the iba System
Learn more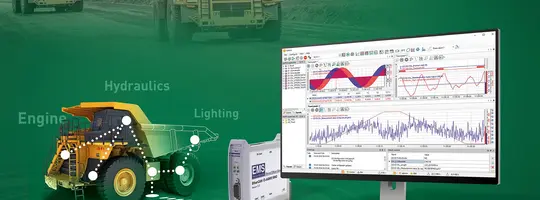
To gain full transparency into machine behavior it is important to get a coherent view of how drives, PLC logic, sensors, and mechanical components…
Learn more
In modern marine propulsion systems, reliable and continuous monitoring of all components is essential to prevent failures and plan maintenance…
Learn more
With ibaNet-E, iba has developed an Ethernet-based protocol for deterministic transmission of measured values.
Learn more
Edge analytics applications allow you to monitor processes locally in real time based on process data. The locally acquired process data can be…
Learn more
The iba system offers several ways to acquire data from the S7 controllers – the right solution for different requirements.
Learn more
The iba system offers several ways to acquire data from the TwinCAT or other EtherCAT-based controllers – the right solution for different…
Learn more
The iba system offers several ways to acquire data from Allen-Bradley controllers, especially via EtherNet/IP – the right solution for different…
Learn more
The iba system offers various ways to acquire data from SIMOTION and SINAMICS drive controllers – the right solution for different requirements.
Learn more
Using the ibaPDA-Interface-SINUMERIK-Xplorer interface, data can be recorded directly from Siemens SINUMERIK CNC control systems. The connection and…
Learn more
Overhead cranes are key components in many production and logistics facilities. It is therefore essential to identify potential fault sources at an…
Learn more
Increasing complexity and process speed pose significant challenges for technology-intensive manufacturing companies. Not only do these factors make…
Learn more
The more complex a system is, the greater the number of components involved in the process. However, as these influence each other, the impact of the…
Learn more
Data has long since become the most important resource of the 21st century. Modern, decentralized industrial plants use industrial bus systems to…
Learn more
To fully unlock the potential of measurement data, it must be democratized – made holistically accessible and usable across all user groups.
Learn more
Flat products are manufactured in several process steps, that do not directly follow each other in chronological order. Some products (the so-called…
Learn more
Usually, the operator does not have a free view on all components and aggregates from the control panel of a rolling mill. This is why camera systems…
Learn more
The task is to detect rhomboidity during a continuous casting process. This needs to be done to allow timely process adjustments and consequently…
Learn more
These leading companies already use this component of the iba system.


Contact us – we look forward to hearing from you! Our experts are happy to answer any questions and help you with any challenges you may face.
Talk to an ExpertRead the inspiring success stories of our satisfied customers.
At the cold rolling mill of thyssenkrupp Electrical Steel (tkES) in Gelsenkirchen, the team faced a familiar yet complex challenge.
Learn more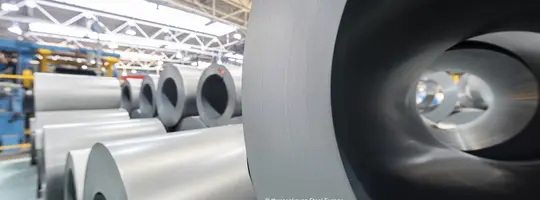
The heat and surface treatment of steel is a complex and sensitive technical process. With the iba system, LSV implemented a comprehensive solution…
Learn more
Over 1,600 tons of metal, rolled into coils, pass through the BILSTEIN Group’s production facilities every day. To eliminate the risk of mix-ups, the…
Learn more
As the legacy system no longer met operational demands, the BILSTEIN GROUP had to seek out a new solution for process data visualization. Their…
Learn more
A strip steel producer based in Germany uses ibaDaVIS to overview and evaluate data over the long term. This allows problems that arise to be solved…
Learn more
Download important resources or contact our support team for further assistance.
Please contact your local sales partner for details.
| Order no. | Name | Description |
|---|---|---|
| 34.040010 | ibaDaVIS-V2 | Data Visualization and Information Service (12 tiles) |
| 34.040100 | ibaDaVIS-upgrade by 12 Tiles | Upgrade by 12 tiles |
