


电源和过程监控
iba 系统能准确地告诉您工厂和能源系统中发生了什么。所有组件都能完美地相互协调--提供所有正在发生的事情的高分辨率记录,以及各种应用所需的所有性能指标和特征值。它能告诉您在哪些方面可以改进流程和整个能源系统。
了解更多信息
ibaDaVIS 允许在网络浏览器中对过程和质量数据以及特征值进行可视化分析。您可以从仪表盘上的概览中交互式地访问详细数据。
Talk to an Expert

ibaDaVIS 可深入洞察您的数据和流程,提供全新的概览和清晰度。
可以根据设备和机器的特征值进行相互比较。监控设备和机器、识别薄弱点和优化潜力所需的精确信息可以快速、轻松地显示出来。
了解 ibaDaVIS 软件的全面功能。
从产品使用案例中获得灵感,了解如何创造价值。
iba 系统能准确地告诉您工厂和能源系统中发生了什么。所有组件都能完美地相互协调--提供所有正在发生的事情的高分辨率记录,以及各种应用所需的所有性能指标和特征值。它能告诉您在哪些方面可以改进流程和整个能源系统。
了解更多信息自动化系统的故障会导致生产停机和质量下降。对于能够访问存档数据的维护人员来说,故障模式分析很容易实现。通过自动或临时分析,用户可以确定因果关系,并采取行动消除或减少重复发生的机会。质量人员在研究潜在的产品缺陷时,也可以运用他们的专业知识。
了解更多信息
基于采集的测量数据、摄像机图像和计算的特征值,可对过程、机器和工厂进行自动实时监控。除了在 ibaPDA 中对违反限值的信号进行简单监控外,ibaInSpectra 和 ibaInCycle 附加组件还可在 ibaPDA 中计算更复杂的特征值,从而实时识别过程变化和异常。同时,ibaVision…
了解更多信息
iba 状态监测系统将基于振动的特征值与工艺和材料数据相结合,可靠地检测设备的磨损情况。它由完美协调的标准组件、中央状态监测中心 ibaCMC 和现场模块化状态监测设备组成。
了解更多信息
为了记录自动生产的产品,需要计算质量数据和特征值,并可靠地存储在质量管理系统中。利用 iba 系统,可以自动将测量数据转换为质量数据,并将这些数据以开放格式保存在数据库或云系统中,从而为产品文档和产品发布生成客户特定的报告。
了解更多信息
iba 系统可连续采集并长期存储高时间分辨率的过程和机器数据。所有数据集中存档、时间同步并可随时访问--为多年运行过程中的数据驱动决策、可追溯性和工艺优化奠定了技术基础。
了解更多信息
要对振动进行可靠的实时监测,用于优化和验证的离线分析工具必不可少。iba 系统可为您提供与过程数据相结合的振动监测和分析协调工具。
了解更多信息
使用 iba 系统进行技术数据采集与分析
了解更多信息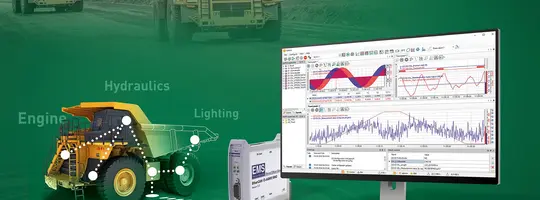
要想获得机器行为的完全透明度,就必须对驱动装置、PLC 逻辑、传感器和机械部件在实际运行条件下的互动情况有一个统一的认识。
了解更多信息
在现代船舶推进系统中,对所有部件进行可靠和持续的监控对于预防故障和有效制定维护计划至关重要。
了解更多信息
通过 ibaNet-E,iba 开发出一种基于以太网的协议,用于确定性地传输测量值。
了解更多信息
通过边缘分析应用程序,您可以根据流程数据对本地流程进行实时监控。本地获取的过程数据可直接在生成处进行自主处理。通过可配置的报警或向控制系统输出,可对偏差立即做出反应。随后,可将结果和特征值轻松安全地集成到云基础设施中。
了解更多信息
iba 系统提供多种从 S7 控制器获取数据的方法,可满足不同需求。
了解更多信息
iba 系统提供了多种从 TwinCAT 或其他基于 EtherCAT 的控制器获取数据的方法 - 在每种情况下都能满足不同的要求。iba 解决方案尤其支持 TwinCAT 2 和 TwinCAT 3。
了解更多信息
iba 系统提供多种从 Allen-Bradley 控制器获取数据的方法,特别是通过 EtherNet/IP - 适合不同要求的解决方案。
了解更多信息
iba 系统提供了从 SIMOTION 和 SINAMICS 驱动控制器获取数据的多种方式,是满足不同需求的正确解决方案。
了解更多信息
使用 ibaPDA-Interface-SINUMERIK-Xplorer 界面,可直接从西门子 SINUMERIK CNC 控制系统记录数据。连接和信号选择与所有 Xplorer 接口一样简单。
了解更多信息
桥式起重机是许多生产和物流设施的关键部件。因此,必须及早发现潜在的故障源,并积极规划维护活动。
了解更多信息
日益增长的复杂性和流程速度给技术密集型制造企业带来了巨大挑战。这些因素不仅增加了流程的理解、分析、维护和优化难度,也使各部门之间的顺利合作变得更加复杂。
了解更多信息
系统越复杂,流程中涉及的组件数量就越多。然而,由于这些组件之间相互影响,由此产生的相互作用对整个流程行为的影响很难再现。为了更好地了解这些关系,必须记录大量的原始数据进行流程分析。这些数据可直接用于计算边缘特征值,然后导出到云端进行分析。这样,OT 和 IT 网络之间就有了明确的分界线。
了解更多信息
数据早已成为 21 世纪最重要的资源。现代分散式工业设备使用工业总线系统将大量执行器和传感器数据传输到控制系统。借助合适的工具,如 iba AG 的 ibaBM-PN 总线监控器,可以确定性地记录和分析通信过程中的数据。这对复杂自动化过程的经济性和无故障运行具有重要意义。
了解更多信息
要充分释放测量数据的潜力,就必须实现测量数据的民主化,使所有用户群体都能全面获取和使用测量数据。
了解更多信息
扁平产品的生产分为几个工序,这些工序之间并没有直接的时间顺序关系。有些产品(即所谓的钢卷)必须临时存放。在标记、存储或向下一工序提供钢卷时,可能会出现错误或混淆。
了解更多信息
通常情况下,操作员无法从轧机的控制面板上自由查看所有部件和集料。因此,摄像系统被用于过程监控领域。因此,可以从控制面板上识别工艺过程中的干扰,并采取适当的应对措施。
了解更多信息
任务是在连铸过程中检测斜度。要做到这一点,就必须及时调整工艺,从而避免下游轧机出现问题。
了解更多信息
这些领先企业已经使用了 iba 系统的这一组件。


联系我们--我们期待您的来信!我们的专家很乐意回答您的任何问题,并帮助您应对可能面临的任何挑战。
咨询专家阅读我们满意客户的鼓舞人心的成功故事。
由于原有系统已无法满足业务需求,BILSTEIN 集团不得不为流程数据可视化寻找新的解决方案。他们的选择是:iba 系统。
了解更多信息
一家位于德国的带钢生产商使用 ibaDaVIS 系统对数据进行长期监控和评估。这样就能更快地解决出现的问题,从而主动启动全新的评估方法。
了解更多信息
在位于盖尔森基兴的蒂森克虏伯电工钢公司(tkES)冷轧厂,团队面临着一个熟悉而又复杂的挑战。
了解更多信息
钢材的热处理和表面处理是一项复杂而敏感的技术工艺。LSV 利用 iba 系统为数字数据采集、分析和评估提供了全面的解决方案。
了解更多信息
下载重要资源或联系我们的支持团队以获取更多帮助。
