Power and Process Monitoring
The iba system tells you exactly what is happening in your plants and your energy system. The components are all perfectly coordinated with one…
Learn more
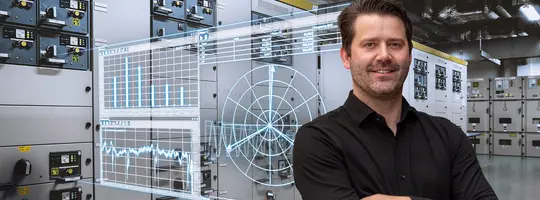
ibaAnalyzer is the central component for data analysis in the iba system. It offers broad functionality for computing and evaluating while being intuitive to operate. ibaAnalyzer is licensed free of charge, add-on products are available to enhance the functionality of ibaAnalyzer.
Try ibaAnalyzer Now – Free of Charge!

ibaAnalyzer is characterized by its wide range of analysis and evaluation functions. The application offers intuitive operation at the same time as a complex scope of functions.
ibaAnalyzer has a free license for analysis of measurement data created using the iba system. Analysis rules can be flexibly created and individually adapted. This enables users to create the appropriate analyses for their purposes, for example analyzing failures or performing long term analyses, in order to assess processes and optimize them.
Discover the comprehensive possibilities of the ibaAnalyzer software.
With ibaAnalyzer, users can directly open and view measurement files in DAT format, the native file type used within the iba system for storing time-synchronized process data. This capability allows engineers, analysts, and maintenance teams to quickly access both raw and calculated values without requiring conversion or data preprocessing.
Upon opening a DAT file, ibaAnalyzer provides immediate access to all recorded signals, metadata, and annotations. The software’s interactive interface lets users navigate through the timeline, zoom into areas of interest, and switch between different visualization modes such as trends, FFTs, or statistical overviews. Because DAT files maintain full time synchronization between channels, complex multi-signal analyses can be carried out with complete accuracy.
Key capabilities
Typical use cases
By opening DAT files natively, ibaAnalyzer ensures fast, accurate, and efficient access to rich process datasets for effective troubleshooting, optimization, and quality control.
ibaAnalyzer provides seamless access to historical process data stored in ibaHD-Server, enabling users to retrieve exactly the information they need for post-process analysis. Instead of working only with locally stored measurement files, analysts can connect directly to the central high-density data repository and query specific time ranges, signals, or events.
The query process is highly flexible: users can define time intervals, apply filters, and select multiple signals from large datasets without having to download entire archives. Retrieved data is loaded into ibaAnalyzer’s interactive environment, where it can be visualized, compared, and processed using the full range of analysis tools. Because ibaHD-Server stores data with precise time synchronization, queried results maintain full alignment across all channels for accurate evaluations.
Key capabilities
Typical use cases
By enabling direct querying from ibaHD-Server, ibaAnalyzer turns historical data into an on-demand resource for troubleshooting, optimization, and performance monitoring.
ibaAnalyzer allows users to directly access and analyze data stored in SQL-based databases, integrating process measurements with information from external systems such as MES, ERP, or quality management platforms. This connection makes it possible to combine iba’s time-synchronized process data with operational, logistical, or quality datasets for a complete production overview.
Through its database interface, ibaAnalyzer can query specific tables and fields, and use conditions, retrieving exactly the records needed for the analysis task. Retrieved data can be visualized alongside measurement signals, enabling correlation between process events and business or quality data. The integration supports many common database systems including Oracle, Microsoft SQL Server, PostgreSQL, and MySQL, ensuring compatibility in diverse IT environments.
Key capabilities
Typical use cases
By querying SQL databases directly, ibaAnalyzer extends its capabilities beyond measurement files, enabling data-driven decision-making that bridges production and business systems.
ibaAnalyzer can import and analyze process data from a wide range of external file formats, making it easy to integrate measurements from third-party systems into the iba analysis environment. This capability allows users to work with heterogeneous datasets without manual conversion, ensuring that valuable process information from different sources can be evaluated together.
Supported formats include standard text and CSV files, binary measurement formats such as Comtrade and Parquet, and application-specific exports from other analysis tools or data acquisition systems. Once imported, external data is treated like native iba data—meaning it can be visualized, synchronized, and processed using ibaAnalyzer’s full range of tools, including trend analysis, statistical evaluation, and frequency analysis.
Key capabilities
Typical use cases
By reading external file formats directly, ibaAnalyzer makes it possible to create a unified analysis workspace that bridges different measurement systems and data sources.
ibaAnalyzer can aggregate high-resolution measurement data, compute characteristic values and KPIs, and publish those results to SQL databases or standard external file formats. Calculations and pre-processing are done inside ibaAnalyzer so the values stored are traceable and ready for integration into MES, ERP or data-warehouse systems. For automated, scheduled, or event-triggered publishing, ibaDatCoordinator can run extraction jobs and push results to databases or files without manual interaction.
Key capabilities
Typical use cases
By pre-computing and publishing traceable KPIs, the iba toolchain ensures that downstream systems receive compact, meaningful, and auditable process information.
With ibaAnalyzer’s built-in Data Extractor, users can seamlessly transform and export high-resolution measurement signals into SQL databases or a wide range of standard file formats. This ensures that critical process and quality data from iba data files can be integrated into reporting systems, analysis platforms, or long-term archives without losing fidelity. Extraction can be performed interactively or automated using ibaDatCoordinator.
Key capabilities
Typical use cases
By enabling both database connectivity and flexible file export, ibaAnalyzer ensures that measurement data is always accessible in the right structure and format for downstream applications.
ibaAnalyzer includes powerful reporting capabilities that transform raw measurement data into clear, structured, and actionable reports. With ibaAnalyzer-Reportgenerator, recurring reports can be created automatically from predefined templates—ensuring that every analysis run produces consistent, high-quality documentation without repetitive manual effort.
Reports can contain signal trends, KPIs, statistical evaluations, maps, and synchronized video snapshots, all drawn directly from the analyzed datasets. Because the content is dynamically linked to the underlying data, reports always reflect the most current results. Users can customize layouts, incorporate company branding, and define event-driven or time-based triggers to automatically generate and distribute reports.
Key capabilities
Typical use cases
By turning raw measurement data into structured reports, ibaAnalyzer helps organizations communicate insights effectively, ensuring that stakeholders at every level can make informed decisions.
ibaAnalyzer allows you to save complete analysis settings, including selected signals, display layouts, calculation formulas, and extraction profiles—for consistent reuse. This eliminates repetitive setup work and ensures evaluations are performed in a standardized, reproducible way across teams or over long periods of time.
For further efficiency, the optional ibaDatCoordinator takes stored analysis configurations and runs them automatically in the background. Jobs can be scheduled, triggered by events, or executed in batches. This means recurring analyses, data extractions, or report compilations happen reliably without manual interaction, freeing up engineers to focus on interpreting results instead of managing workflows.
Key capabilities
Typical use cases
By combining reusable settings with automation, ibaAnalyzer and ibaDatCoordinator provide a robust framework for efficient, repeatable, and hands-free analysis workflows.
With its comprehensive visualization and analysis capabilities, ibaAnalyzer enables engineers to explore machine and process signals in detail. Signals can be displayed intuitively in multiple formats, compared across channels, and examined with mathematical and statistical tools to uncover patterns, deviations, or root causes.
This functionality forms the backbone of precise diagnostics and process optimization.
Key capabilities
These capabilities provide a deep understanding of machine behavior and process dynamics, ensuring that even complex interactions are made transparent.
Typical use cases
By combining clear visualization with advanced analytical methods, ibaAnalyzer empowers users to transform raw measurement signals into actionable insights for better performance and reliability.
ibaAnalyzer offers powerful tools to display and explore time series and signal data interactively, enabling users to understand process behavior at a glance. Whether working with measurements from DAT files, ibaHD-Server queries, or imported datasets, the software provides multiple visualization options to reveal trends, anomalies, and correlations.
Users can select classic trend charts, zoomable multi-signal displays, FFT frequency views, scatter plots, and specialized diagrams for deeper analysis. Interactive features—such as synchronized markers, scaling, and intervals—make it easy to focus on specific events or compare multiple signals. Because ibaAnalyzer maintains full time synchronization between channels, even complex datasets can be analyzed with complete temporal accuracy.
Key capabilities
Typical use cases
With its versatile visualization capabilities, ibaAnalyzer turns raw time series and signal data into clear, actionable insights for troubleshooting, optimization, and quality assurance.
ibaAnalyzer makes it easy to explore process data at different levels of detail by offering intuitive zoom and drill-down functionality. This allows users to move seamlessly from a high-level overview of long-term trends to detailed views of individual events, all within the same dataset.
Using zoom, operators can quickly focus on specific time intervals or signal regions, while the drilldown feature enables a stepwise transition to higher-resolution data—such as moving from aggregated hourly averages to second-by-second values. All navigation maintains time-synchronized alignment across signals, ensuring that relationships between variables remain visible at every scale.
Key capabilities
Typical use cases
By enabling smooth navigation across multiple aggregation levels, ibaAnalyzer lets users connect the big picture with fine-grained details, making analysis faster, clearer, and more accurate.
ibaAnalyzer provides a comprehensive set of tools to evaluate and relate multiple datasets—whether they originate from different measurement runs, plant sections, or external sources. Users can directly compare signals side by side, quantify differences through statistical metrics, and perform synchronization or alignment to ensure time and positional consistency.
Correlation functions allow analysts to identify relationships between variables, while aggregation tools combine multiple datasets into meaningful summaries, such as averages, sums, or key performance indicators (KPIs). These capabilities make it possible to merge and evaluate diverse data sources in a single environment, enabling a complete and unified view of process behavior.
Key capabilities
Typical use cases
By enabling precise comparison, alignment, correlation, and aggregation, ibaAnalyzer ensures that complex, multi-source datasets become coherent, actionable insights for process optimization and quality control.
ibaAnalyzer enables users to convert signals seamlessly between different domains—time, length, and frequency—so that data can be analyzed in the most relevant context for the process. Time-based measurements can be transformed into length-related views for product-specific evaluation, or into the frequency domain using FFT for vibration, power quality, or other spectral analyses.
Beyond domain transformations, ibaAnalyzer offers powerful calculation tools to derive metrics and Key Performance Indicators (KPIs) directly from measurement data. Users can compute averages, maxima, standard deviations, or custom formulas, as well as process-specific quality measures. These results can be displayed alongside original signals or exported for use in reports and higher-level systems.
Key capabilities
Typical use cases
By combining domain transformation with KPI calculation, ibaAnalyzer empowers engineers to view, interpret, and quantify process performance from multiple analytical perspectives.
ibaAnalyzer allows users to apply operations to signals and instantly see the results through its WYSIWYG (What You See Is What You Get) interface. Whether performing arithmetic calculations, filtering noise, scaling values, or combining multiple signals, changes are reflected immediately in the visualization, enabling fast, iterative analysis without guesswork.
This interactive approach makes it possible to test different processing methods—such as smoothing, integration, or differentiation—while directly observing their effects on trends, spectra, or other graphical views. Because all transformations maintain full time synchronization, users can confidently evaluate the impact of signal processing steps before finalizing calculations or generating reports.
Key capabilities
Typical use cases
With immediate, visual feedback on signal operations, ibaAnalyzer turns data processing into an interactive, transparent, and efficient process, ensuring confidence in every analytical step.
ibaAnalyzer can be expanded beyond its standard toolset by creating custom macros and computation modules tailored to specific analysis needs. This flexibility allows engineers and analysts to embed their own logic, formulas, or processing routines directly into the analysis workflow, ensuring the software adapts to unique plant processes or quality requirements.
Macros can automate repetitive analysis steps, standardize evaluations across teams, or integrate plant-specific KPIs into every dataset. Custom computation modules extend the mathematical and statistical capabilities of ibaAnalyzer, enabling advanced calculations, condition-based logic, or integration with external algorithms. These extensions work seamlessly with all ibaAnalyzer visualization and synchronization features, ensuring that user-defined results remain aligned with raw and processed signals.
Key capabilities
Typical use cases
By extending its core functions with user-defined macros and computation modules, ibaAnalyzer becomes a fully adaptable analysis platform that grows with the needs of the plant and its processes.
ibaAnalyzer makes it easy to share analysis results instantly by allowing users to copy signal data or charts directly to the clipboard. This enables fast transfer of trends, graphs, or numerical datasets into emails, documents, or presentations without exporting files or performing additional formatting.
Charts can be copied exactly as they appear on screen, preserving zoom levels, colors, annotations, and overlays for clear communication. Likewise, numerical signal data can be copied in a structured format, ready to paste into spreadsheets or reports for further use. This quick sharing capability speeds up collaboration between operators, engineers, and management, ensuring that insights are communicated while they are still actionable.
Key capabilities
Typical use cases
By enabling rapid sharing via the clipboard, ibaAnalyzer ensures that critical process insights can be communicated quickly and effectively, improving collaboration and decision-making.
ibaAnalyzer integrates seamlessly with ibaCapture, enabling users to analyze process sensor data and video recordings in perfect synchronization—either by time or by product length. This powerful combination allows operators and engineers to correlate visible process events with underlying measurement signals, creating a complete picture of what happened and why.
In a synchronized view, video frames align precisely with the corresponding data points from the process, making it possible to identify the exact moment of defects, equipment malfunctions, or process deviations. Users can zoom, navigate, and compare signals and video footage together, ensuring no detail is overlooked. Length-based synchronization adds an additional layer of accuracy for continuous products, allowing visual inspection to match exact positions along the strip, sheet, or coil.
Key capabilities
Typical use cases
By combining sensor and video data in a synchronized analysis, ibaAnalyzer with ibaCapture delivers unmatched clarity and context, turning process monitoring into actionable insight.
The Maps view in ibaAnalyzer displays GPS positions and routes alongside high-resolution measurement data, so you can see when and where events occurred. Simply record longitude and latitude signals, then correlate location with process behavior in a dockable map. The map view supports different map types, route styling, two-way coupling with markers, and integrated playback for time-synchronized review. Maps can also be included in ibaAnalyzer-Reportgenerator reports.
Key capabilities
Typical use cases
By bringing GPS data onto the same canvas as your process signals, ibaAnalyzer turns geolocation into a powerful diagnostic dimension, so you can see what happened, when it happened, and exactly where.
ibaAnalyzer-InCycle provides specialized tools to visualize,analyze and evaluate cyclical and rotating machinery, making it easier to understand vibrations, harmonics, and other periodic phenomena. Signals from turbines, motors, drives, or gearboxes can be transformed into the frequency domain, overlaid with harmonic markers, or displayed as orbit and order spectra to reveal mechanical conditions that are hidden in standard time trends.
Users can configure monitoring profiles tailored to specific machine characteristics, including operating speeds, bearing frequencies, or critical harmonics. This enables fast detection of imbalance, misalignment, or wear, and supports condition-based maintenance strategies. Combined with length- and time-based analysis, cyclical monitoring delivers both short-term diagnostic insight and long-term trend visibility.
Key capabilities
Typical use cases
By offering configurable analysis of cyclical and rotating processes, ibaAnalyzer ensures early fault detection and reliable machinery monitoring, reducing downtime and protecting critical assets.
ibaAnalyzer-InSpectra provides dedicated functions to visualize, analyze and evaluate vibration signals, supporting both detailed diagnostics and long-term monitoring. Using high-resolution data, vibrations can be examined in time, frequency, and order domains, giving a complete picture of machine behavior under varying operating conditions.
Analysts can configure vibration monitoring by defining characteristic frequencies, orders, and thresholds relevant to bearings, shafts, or housings. The software supports FFT analysis, orbit diagrams, envelope detection, and statistical evaluations, enabling early detection of faults such as imbalance, misalignment, or bearing damage. These vibration insights can be combined with process signals to directly link mechanical issues with operational events.
Key capabilities
Typical use cases
With its configurable vibration analysis, ibaAnalyzer helps engineers to detect mechanical issues early, reduce downtime, and optimize maintenance strategies.
Get inspired by product use cases and learn how value is created.
The iba system tells you exactly what is happening in your plants and your energy system. The components are all perfectly coordinated with one…
Learn more
Failures in automated systems can lead to production downtime and inferior quality. Failure mode analysis is easily achieved for maintenance personnel…
Learn more
Automated real time monitoring of processes, machines and plants is based on acquired measurement data, camera images and calculated characteristic…
Learn more
The iba Condition Monitoring System combines vibration-based characteristic values with process and material data to reliably detect wear on plants.…
Learn more
For documenting the automatically manufactured products, quality data and characteristic values need to be calculated and reliably stored in a quality…
Learn more
The iba system enables continuous acquisition and long-term storage of process and machine data in high temporal resolution. All data is centrally…
Learn more
For reliable real-time monitoring of vibrations, offline analysis tools for optimization and validation are indispensable. The iba system offers you…
Learn more
Technical Data Acquisition and Analysis with the iba System
Learn more
To gain full transparency into machine behavior it is important to get a coherent view of how drives, PLC logic, sensors, and mechanical components…
Learn more
In modern marine propulsion systems, reliable and continuous monitoring of all components is essential to prevent failures and plan maintenance…
Learn more
With ibaNet-E, iba has developed an Ethernet-based protocol for deterministic transmission of measured values.
Learn more
Edge analytics applications allow you to monitor processes locally in real time based on process data. The locally acquired process data can be…
Learn more
The iba system offers several ways to acquire data from the S7 controllers – the right solution for different requirements.
Learn more
The iba system offers several ways to acquire data from the TwinCAT or other EtherCAT-based controllers – the right solution for different…
Learn more
The iba system offers several ways to acquire data from Allen-Bradley controllers, especially via EtherNet/IP – the right solution for different…
Learn more
The iba system offers various ways to acquire data from SIMOTION and SINAMICS drive controllers – the right solution for different requirements.
Learn more
Using the ibaPDA-Interface-SINUMERIK-Xplorer interface, data can be recorded directly from Siemens SINUMERIK CNC control systems. The connection and…
Learn more
Overhead cranes are key components in many production and logistics facilities. It is therefore essential to identify potential fault sources at an…
Learn more
Increasing complexity and process speed pose significant challenges for technology-intensive manufacturing companies. Not only do these factors make…
Learn more
The more complex a system is, the greater the number of components involved in the process. However, as these influence each other, the impact of the…
Learn more
Data has long since become the most important resource of the 21st century. Modern, decentralized industrial plants use industrial bus systems to…
Learn more
To fully unlock the potential of measurement data, it must be democratized – made holistically accessible and usable across all user groups.
Learn more
Flat products are manufactured in several process steps, that do not directly follow each other in chronological order. Some products (the so-called…
Learn more
Usually, the operator does not have a free view on all components and aggregates from the control panel of a rolling mill. This is why camera systems…
Learn more
The task is to detect rhomboidity during a continuous casting process. This needs to be done to allow timely process adjustments and consequently…
Learn more
These leading companies already use this component of the iba system.
Who Rely on the iba System and Test ibaPDA and ibaAnalyzer!
Request a Demo LicenseRead the inspiring success stories of our satisfied customers.
How Badische Stahlwerke Uses the iba System to Bring Transparency to Scrap Charging
Learn more
Badische StahlwerkeAfter the nationwide blackout in Pakistan on January 9, 2023, energy producers came under increasing pressure to enhance plant monitoring and to…
Learn more
At the cold rolling mill of thyssenkrupp Electrical Steel (tkES) in Gelsenkirchen, the team faced a familiar yet complex challenge.
Learn more
The energy transition is fundamentally reshaping power grids: decentralized generation, volatile energy sources, and increasingly dynamic grid…
Learn more
The heat and surface treatment of steel is a complex and sensitive technical process. With the iba system, LSV implemented a comprehensive solution…
Learn more
The commissioning of a new pusher type furnace at their Swiss location prompted Novelis to standardize the acquisition and analysis of process data.…
Learn more
Reducing complexity by calculating KPIs from vibration and machine data in ibaPDA using ibaInSpectra.
Learn more
As the legacy system no longer met operational demands, the BILSTEIN GROUP had to seek out a new solution for process data visualization. Their…
Learn more
The Hirschvogel Group, one of the largest, globally operating automotive suppliers in the field of massive forming of steel and aluminum, decided to…
Learn more
As the legacy system no longer met the requirements, the company Kastamonu Entegre looked for a new way to acquire and analyze data for the wood…
Learn more
When it comes to port logistics, time is money. In order to identify existing bottlenecks more easily and thus to exploit optimization potentials, a…
Learn more
A strip steel producer based in Germany uses ibaDaVIS to overview and evaluate data over the long term. This allows problems that arise to be solved…
Learn more
Alunorf is the largest aluminum rolling and smelting plant in the world. Around 1.5 million tons of rolled aluminum strip are shipped from the plant…
Learn more
The iba system provides a state-of-the-art condition and vibration monitoring system. Since it had been installed, many critical downtimes have been…
Learn more
iba Oceania designed a measuring system for a multiple AC motor VVVF controlled car positioner in a mine. The system was used to determine if load…
Learn more
After a scheduled maintenance shutdown in an Ore Processing Plant, the start-up of a particular Sequence came to a grinding halt whenever a certain…
Learn more
A Condition Monitoring System (CMS) is supposed to monitor the wear of two motors. The CMS calculates characteristic values at regular intervals under…
Learn more
Freight ports are the most important transhipment centres in the world. In Antwerp alone, approximately 10 million containers are loaded and unloaded…
Learn more
To continuously monitor this power transmission, Siemens relies on the modular measurement system from iba.
Learn more
In steel works and metallurgical plants, downtime and repair costs due to the power quality disturbances become an increasing challenge. In addition,…
Learn more
iba Oceania designed and implemented a data logging and analysis package to assist in fault finding and tuning of a Reclaimer Reeler control scheme.…
Learn more

In this video we’ll guide you through the installation of ibaAnalyzer.

In this video we’ll show you how to select and open data files in ibaAnalyzer.

In this video we’ll show you how to select and display signals.

You will now learn about the important features of the graph and signal definitions windows.

In this video, you will learn some of the basic requirements which are necessary for you to create mathematical expressions.

We will now learn how to terminate the ibaAnalyzer session.

In this video, we will learn how to use markers. Markers provide you with the possibility of getting fast information for a selected area on the graph.

In this video you will learn how to open sequential data files and to compare records from different data files.

In this video, you will learn some of the basic requirements which are necessary for you to create mathematical expressions.

In this video, you will learn how to manipulate signals using boolean operations.

In this video, you will learn how to indicate when specified limits have been exceeded by an input signal.

In this video, you will learn how to use the Expression builder to calculate the accumulated weight of strip passing a particular point.
Download important resources or contact our support team for further assistance.
Please contact your local sales partner for details.
| Order no. | Name | Description |
|---|---|---|
| 33.010000 | ibaAnalyzer | Offline analysis tool * |
| 33.010003 | ibaAnalyzer-DB-Read | Offline analysis: read data from SQL databases |
| 33.010008 | ibaAnalyzer-DB-Read-5 | Offline analysis: read data from SQL databases, 5 users |
| 33.010410 | ibaAnalyzer-InSpectra+ | Offline vibration analysis: trend and output of InSpectra results in ibaAnalyzer |
| 33.010411 | ibaAnalyzer-InCycle+ | Offline analysis of cyclic processes: trend and output of InCycle results in ibaAnalyzer |
| 33.010445 | ibaAnalyzer-E-Dat | Offline analysis for external data formats |
| 33.010456 | ibaAnalyzer-Add-On-TDMS-Extract | Offline data extraction from an original DAT file into a TDMS format (free of charge) |
* Software is licensed free of charge for analyzing measurement data generated with the iba system.