Maximum Grid Security for Offshore Wind Power
GE Vernova Relies on the iba System in Sofia Project
Learn more
In today’s digitized industrial plants, recording machine and sensor data has become standard practice. Operators and users leverage this data to detect anomalies, better understand processes, and much more. However, since different user groups pursue diverse objectives, data collection and analysis typically occur within department-specific silos. To fully unlock the potential of measurement data, it must be democratized – made holistically accessible and usable across all user groups.

Data has long since become the most valuable resource of the 21st century; it holds immense worth even in modern industrial environments.
Through advanced data analytics, ongoing processes can be visualized and made comprehensible. The possibilities are vast: analyses and key performance indicator (KPI) calculations enable, for example, reductions in unplanned downtime, improvements in plant efficiency, and assurance of product quality.
Yet, in many organizations, data handling remains fragmented along departmental and application-specific lines, resulting in isolated data silos. Since this limits the full exploitation of data potential, breaking down these silos is imperative. This process is known as data democratization — where data is captured once and made accessible to authorized personnel across the organization. For data-driven enterprises, this step is essential and fosters fact-based communication across departments, enabling holistic process evaluation. However, this can only succeed if relevant data is shared in appropriate formats and via suitable channels.
For measurement systems, several design paradigms are crucial: to capture data from diverse sources, such as controllers from different manufacturers, bus systems, cameras, or HMI screens, comprehensive connectivity to the process is required.
Furthermore, data must be acquired at high resolution and persistently stored long-term within the measurement system. Since different departments typically require different KPIs, this approach enables flexible analyses based on raw data. At the point of data acquisition, it need not yet be determined which analyses will be performed.
The captured data must be stored centrally in a historical data server. This facilitates linking various datasets, for example, joint analysis of vibration data alongside production data can yield deeper insights. Crucially, analyses and KPI calculations can also be supplemented retrospectively. It is not sufficient to provide KPIs alone. Instead, it is necessary to enable a “drilldown” from KPIs back to the raw data, allowing comprehensive root cause analyses without any loss of information.
To minimize barriers for different user groups, an easy-to-use tool ecosystem for data analysis must be available. Users should be able to configure calculations and visualizations in dashboards without requiring programming skills.
Overall, democratizing measurement data offers numerous benefits: different data sources can be quickly correlated, and highly detailed raw data enables flexible, customized analyses. This in turn supports fact-based communication across diverse user groups, helping to prevent disruptions and failures. Data democratization thus drives increased value creation throughout the entire organization.

Measurement data must not belong to a single department or be hidden in data silos – instead, they must represent the entire process and be stored in an openly accessible manner.
Dr. Andreas Quick
Head of Product Management, iba AG
The following functions of the iba system are used in this application.
These leading companies already rely on the iba system.


Read the inspiring success stories of our satisfied customers.
GE Vernova Relies on the iba System in Sofia Project
Learn moreHow Badische Stahlwerke Uses the iba System to Bring Transparency to Scrap Charging
Learn more Badische Stahlwerke
From Paper Chart Recorders to Modern Data Acquisition: To ensure reliable analysis and visualization of furnace data, Aluminium Norf relies on the iba…
Learn more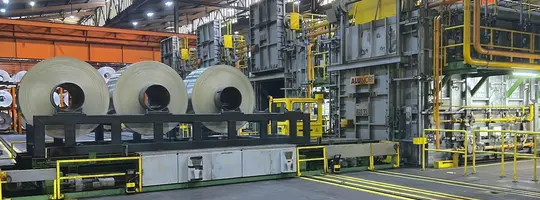
After the nationwide blackout in Pakistan on January 9, 2023, energy producers came under increasing pressure to enhance plant monitoring and to…
Learn more
At the cold rolling mill of thyssenkrupp Electrical Steel (tkES) in Gelsenkirchen, the team faced a familiar yet complex challenge.
Learn more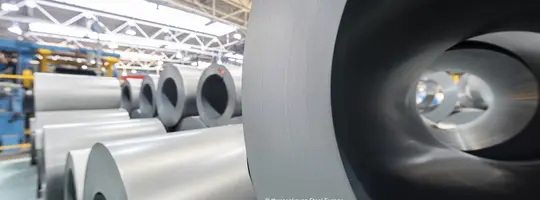
The energy transition is fundamentally reshaping power grids: decentralized generation, volatile energy sources, and increasingly dynamic grid…
Learn more
In the production of aluminum coils, proper strapping is essential to ensure safe handling and transport.
Learn more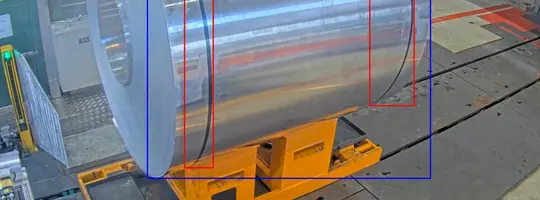
A mining company uses the iba system to maximize the availability of electric rope shovels.
Learn more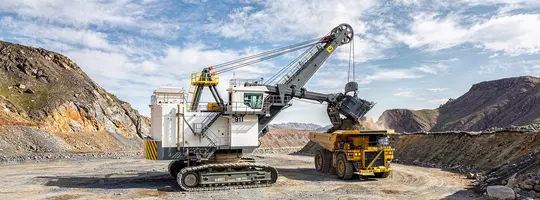 AI-generated Image
The heat and surface treatment of steel is a complex and sensitive technical process. With the iba system, LSV implemented a comprehensive solution…
Learn more
In order to analyze processes efficiently, Neuman Aluminium introduced the iba system in production in 2014. Due to its success, it was rolled out to…
Learn more
The commissioning of a new pusher type furnace at their Swiss location prompted Novelis to standardize the acquisition and analysis of process data.…
Learn more
Over 1,600 tons of metal, rolled into coils, pass through the BILSTEIN Group’s production facilities every day. To eliminate the risk of mix-ups, the…
Learn more
What began seven years ago with the replacement of paper chart recorders in a pusher-type furnace has evolved into a key pillar of quality assurance…
Learn more
Reducing complexity by calculating KPIs from vibration and machine data in ibaPDA using ibaInSpectra.
Learn more
As the legacy system no longer met operational demands, the BILSTEIN GROUP had to seek out a new solution for process data visualization. Their…
Learn more
Successful applications and real solutions with the iba system.
The iba system tells you exactly what is happening in your plants and your energy system. The components are all perfectly coordinated with one…
Learn more
Failures in automated systems can lead to production downtime and inferior quality. Failure mode analysis is easily achieved for maintenance personnel…
Learn more
Automated real time monitoring of processes, machines and plants is based on acquired measurement data, camera images and calculated characteristic…
Learn more
The iba Condition Monitoring System combines vibration-based characteristic values with process and material data to reliably detect wear on plants.…
Learn more
For documenting the automatically manufactured products, quality data and characteristic values need to be calculated and reliably stored in a quality…
Learn more
The iba system enables continuous acquisition and long-term storage of process and machine data in high temporal resolution. All data is centrally…
Learn more
For reliable real-time monitoring of vibrations, offline analysis tools for optimization and validation are indispensable. The iba system offers you…
Learn more
Technical Data Acquisition and Analysis with the iba System
Learn more
To gain full transparency into machine behavior it is important to get a coherent view of how drives, PLC logic, sensors, and mechanical components…
Learn more
In modern marine propulsion systems, reliable and continuous monitoring of all components is essential to prevent failures and plan maintenance…
Learn more
With ibaNet-E, iba has developed an Ethernet-based protocol for deterministic transmission of measured values.
Learn more
Edge analytics applications allow you to monitor processes locally in real time based on process data. The locally acquired process data can be…
Learn more
The iba system offers several ways to acquire data from the S7 controllers – the right solution for different requirements.
Learn more
The iba system offers several ways to acquire data from the TwinCAT or other EtherCAT-based controllers – the right solution for different…
Learn more
The iba system offers several ways to acquire data from Allen-Bradley controllers, especially via EtherNet/IP – the right solution for different…
Learn more
Cross-departmental usability of measurement data requires centralized, high-resolution data acquisition and consistent storage without data silos. With ibaPDA, process, control, and sensor data from multiple sources are synchronously captured and stored long-term in ibaHD-Server, a central data historian. Using ibaAnalyzer, this data can be flexibly analyzed and prepared for different departments, including retrospective KPI calculations. In addition, ibaDatCoordinator enables structured data distribution into IT and OT systems.
Data silos typically arise from separated systems used by production, maintenance, and engineering, each maintaining its own datasets. A centralized measurement data architecture using ibaPDA for acquisition and the ibaHD-Server for long-term storage consolidates all relevant data sources. This enables combined analysis of vibration, process, and quality data without information loss. ibaAnalyzer supports direct drill-down from aggregated KPIs to raw signal level.
Effective KPI drill-down requires high-resolution, time-synchronized storage of all raw data. With ibaPDA, this data is continuously acquired and archived in ibaHD-Server, enabling every KPI to be traced back to its underlying measurements. ibaAnalyzer allows interactive navigation from aggregated metrics down to individual signals and timestamps. This enables transparent root-cause analysis without information loss.
Centralized data storage is essential for unifying data from heterogeneous sources such as control systems, sensors, and fieldbuses. ibaHD-Server acts as a central historian platform where all process data is stored long-term and in a time-synchronized manner. This enables the combination of different datasets, for example joint analysis of process and quality data. ibaPDA ensures continuous, high-resolution data acquisition.
Flexible KPI analysis requires tooling that supports both real-time and offline evaluation without programming. With ibaAnalyzer, users can configure custom calculations, visualizations, and reports directly based on raw data. ibaPDA provides the underlying high-resolution measurement data that can be reused for any future analysis. This allows new analytical requirements to be implemented without modifying the data acquisition setup.
